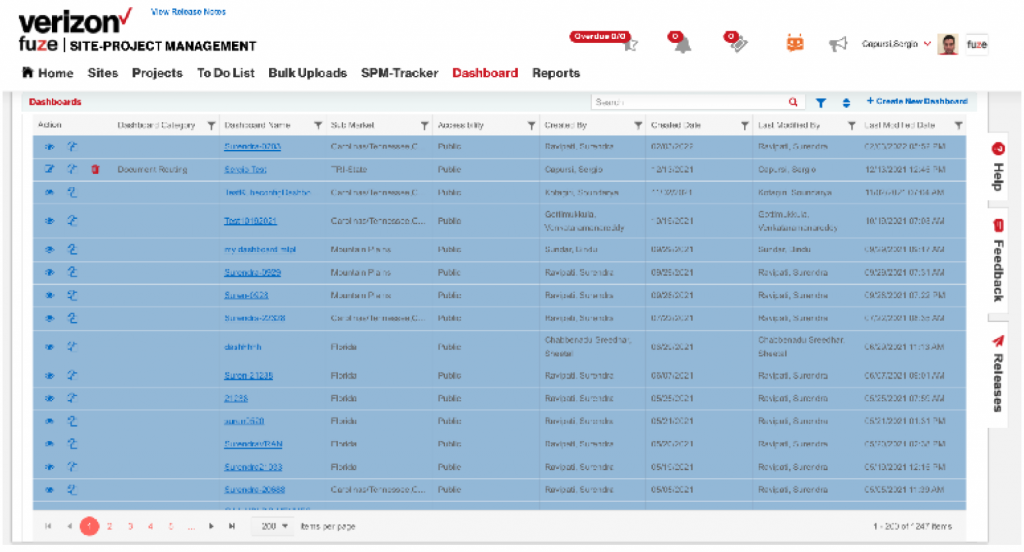
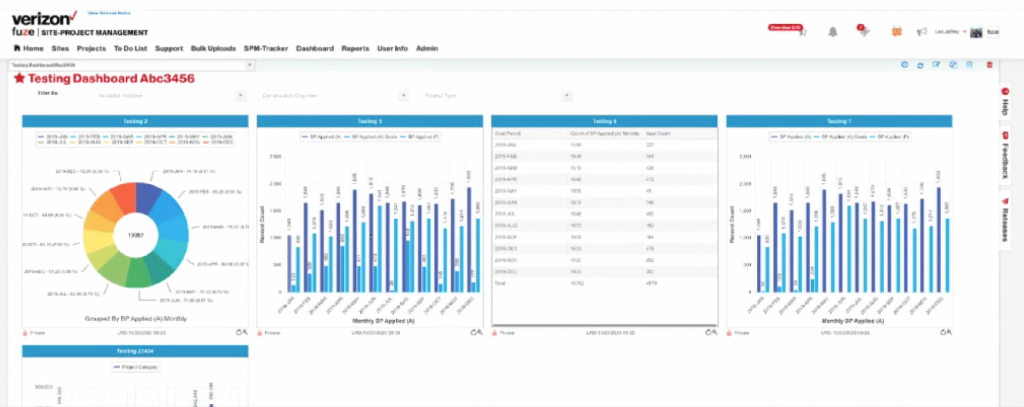
One of the most important applications in Verizon FUZE is the reporting tool called SPM Dashboards. Dashboards are a way for Network Engineers to see at a high level the performance of particular projects. The legacy application had about 1,500 users. The key objective was to redesign the application from the ground up. The previous application had many issues and pain points with the UI.
The method chosen to recreate the new Dashboard application was the Design Thinking Stanford Model. The model is a non-linear, iterative process intended to understand users, challenge assumptions, define problems, and create solutions to prototype and test. There are 5 phases:


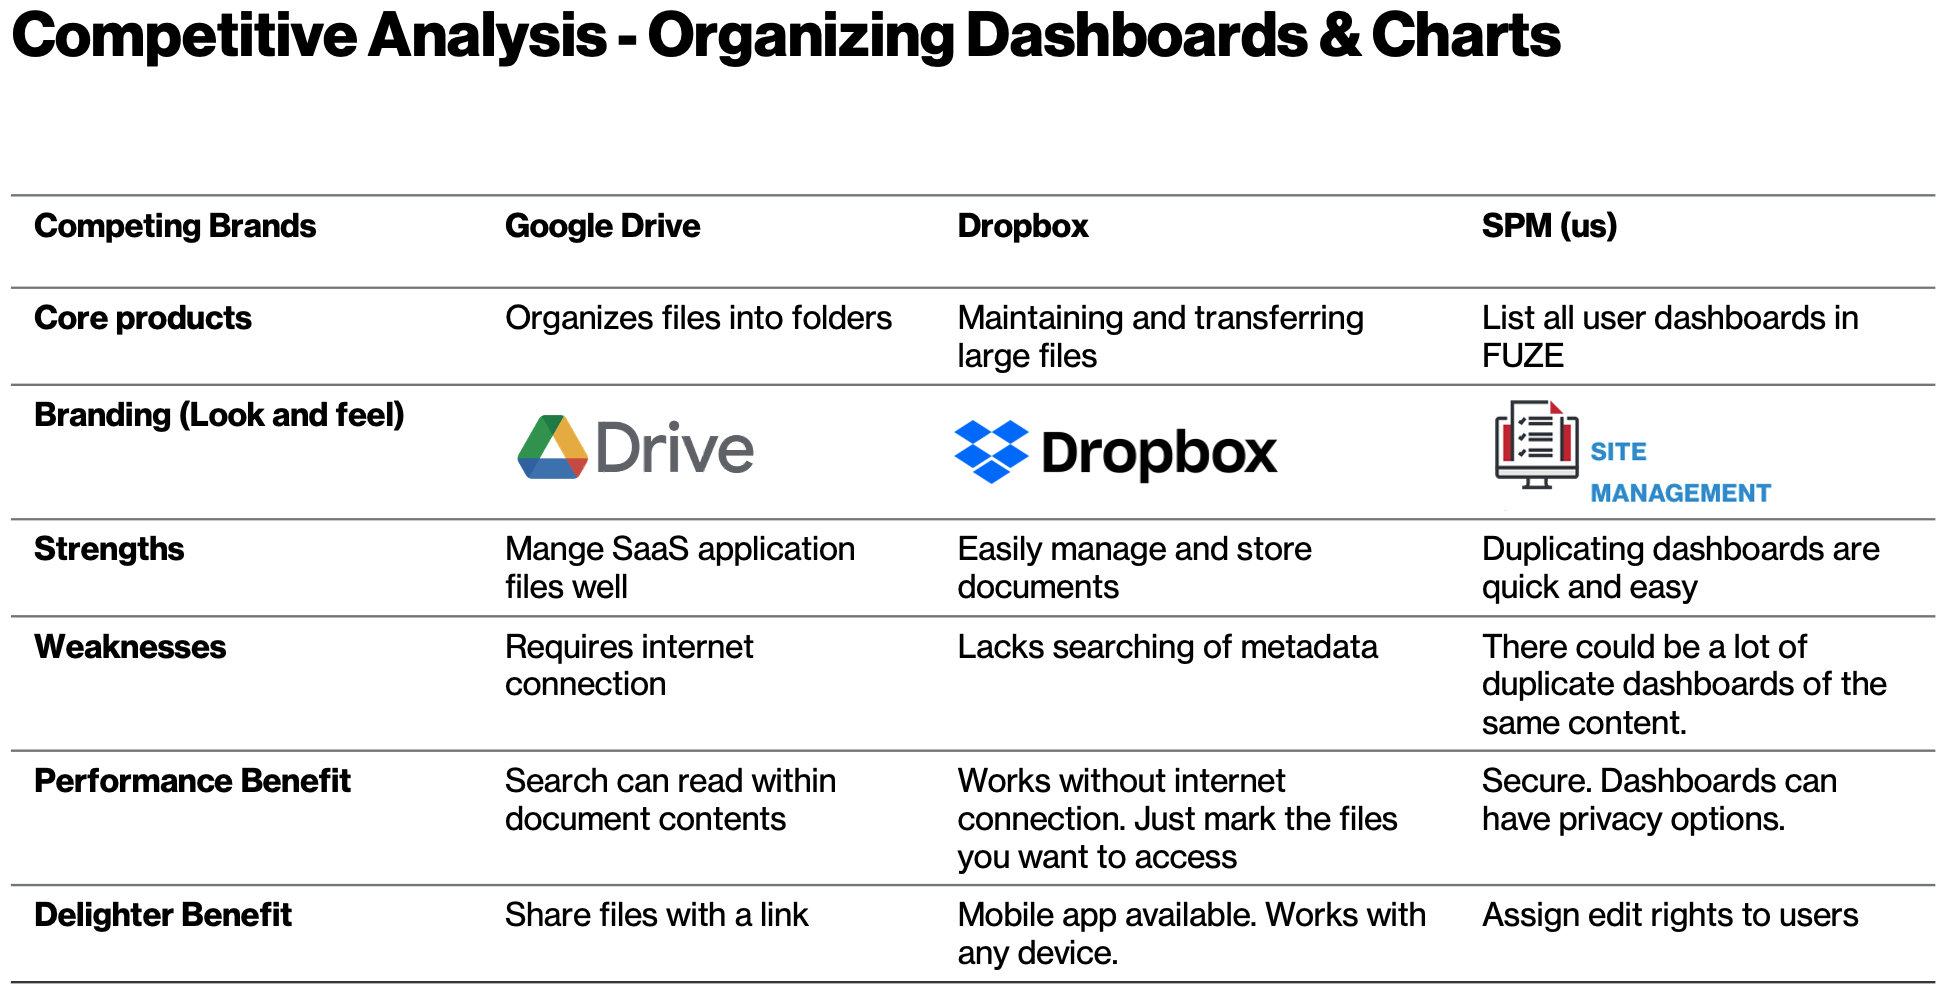
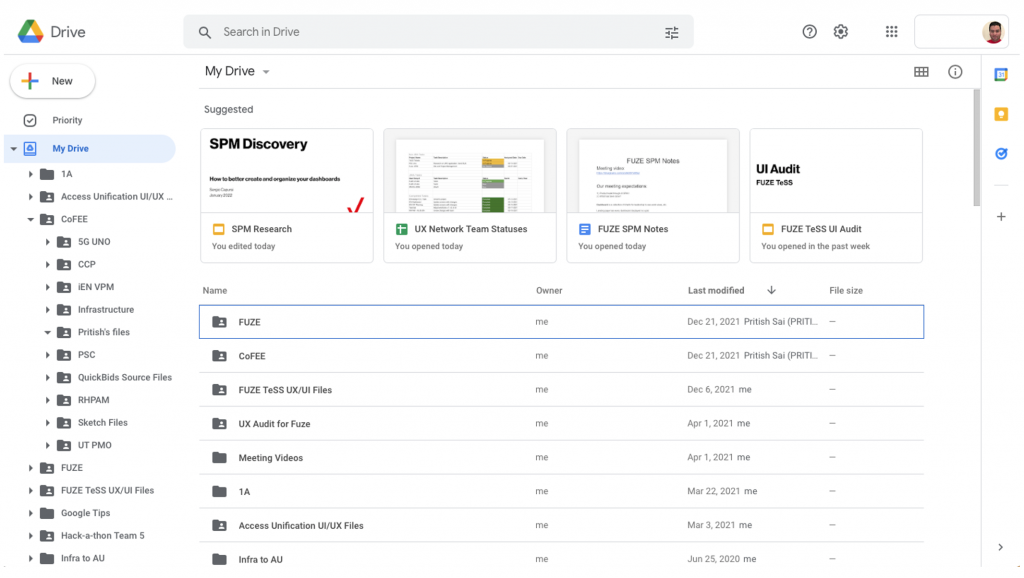
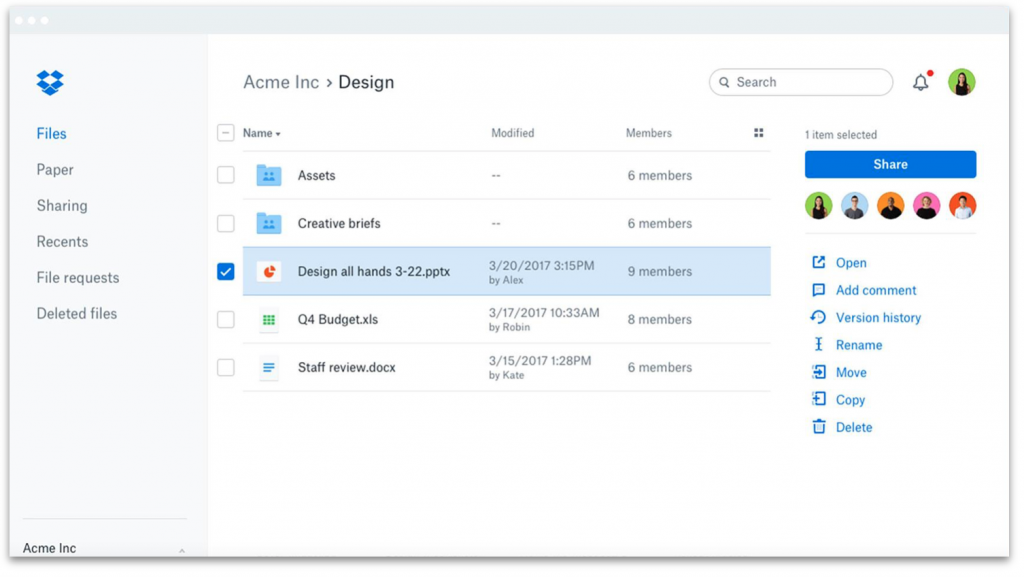
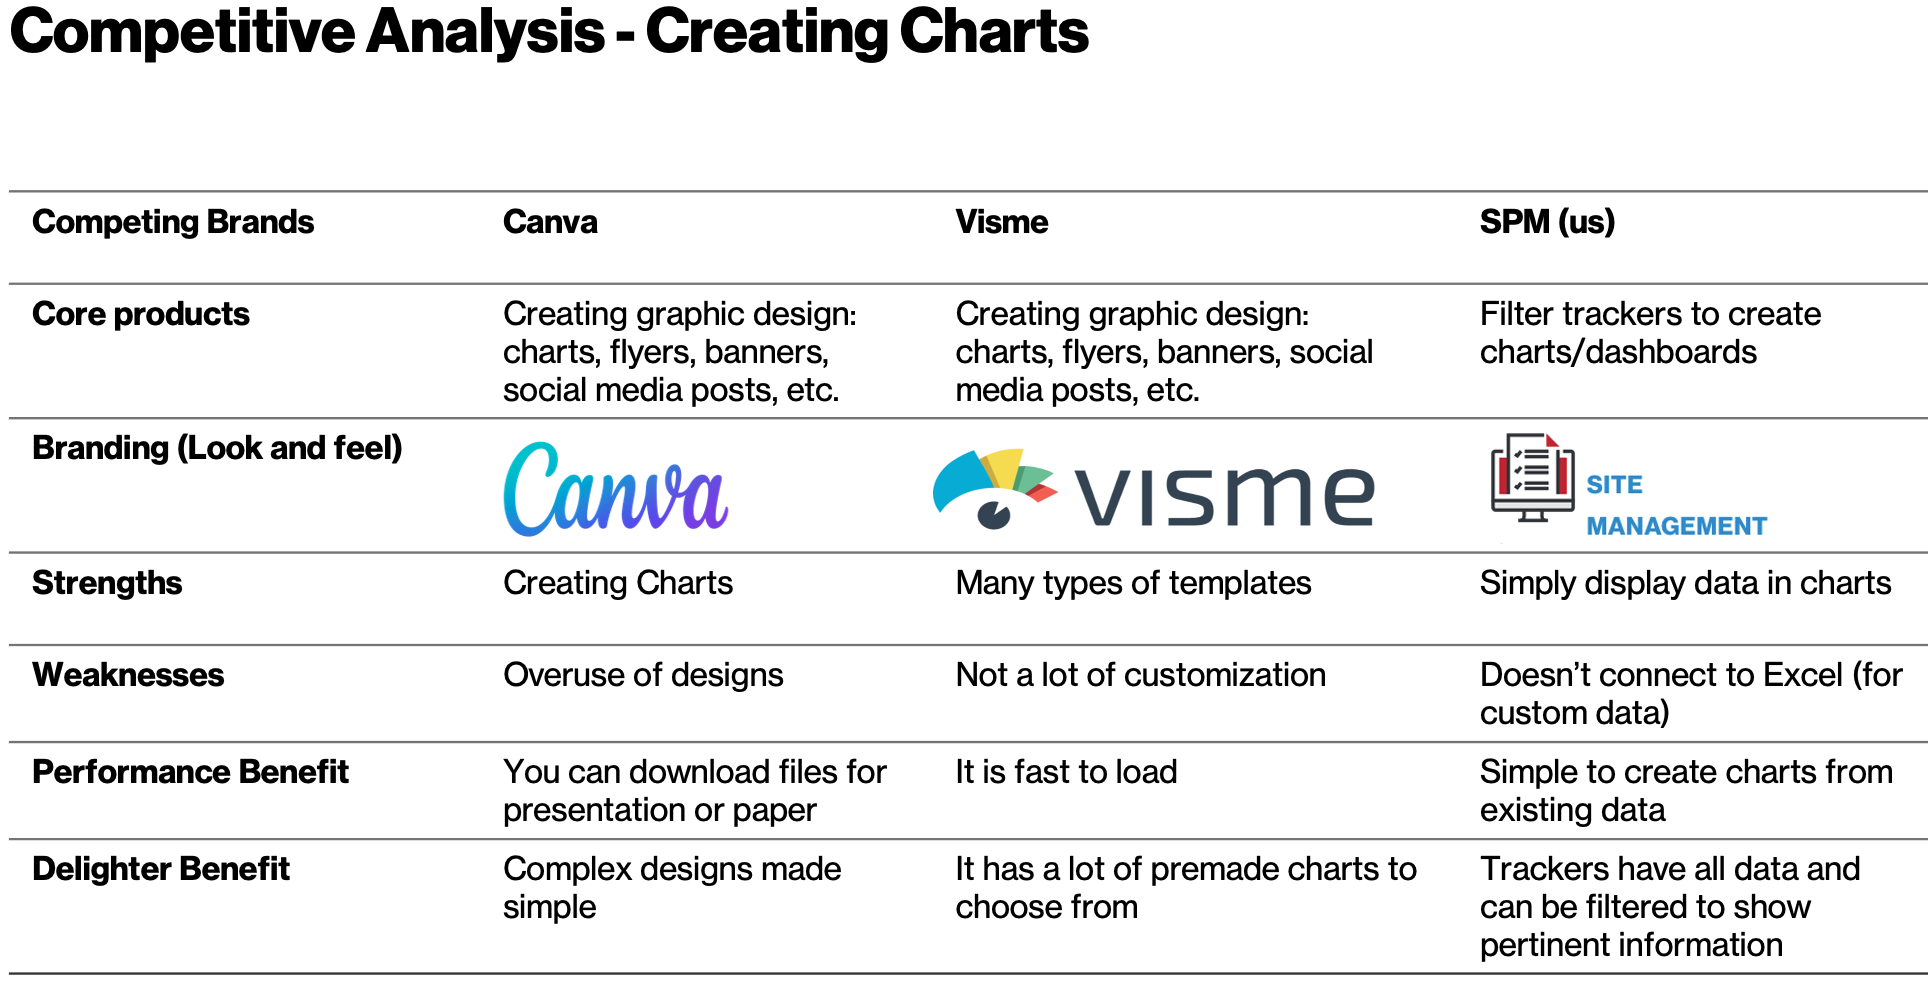
Empathize – involves interviewing users, conducting surveys, creating personas, user journey maps, competitive analysis, etc. In this stage our ux team observed what users do and how they interact with the application. These observations gave clues about what users think and feel about the legacy Dashboard application. After deploying a System Usability Scale (SUS) survey to the 1,500 users, the design team were able to learn initial problem areas come up with questions for the interviews.
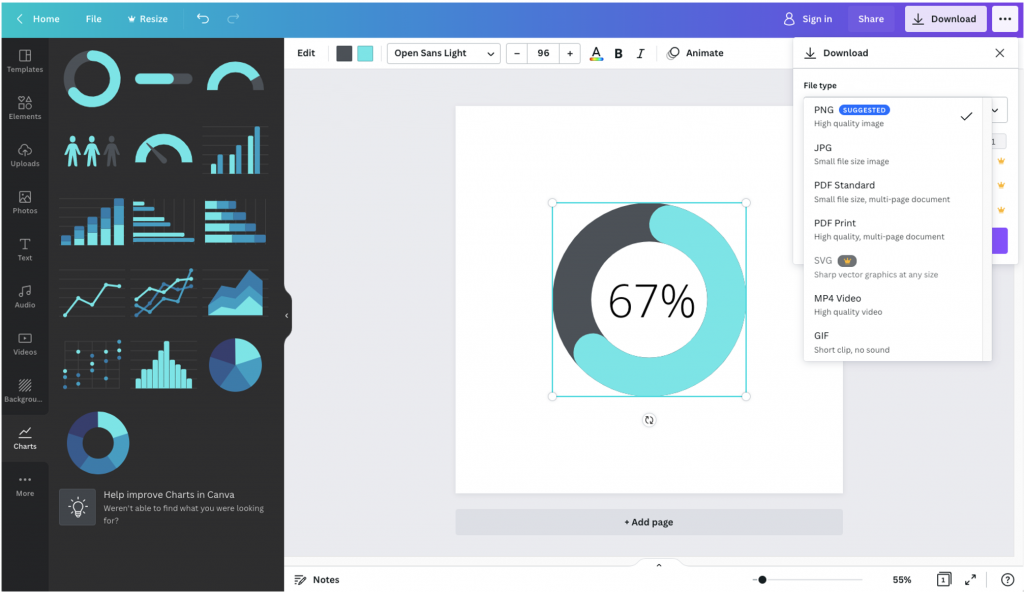
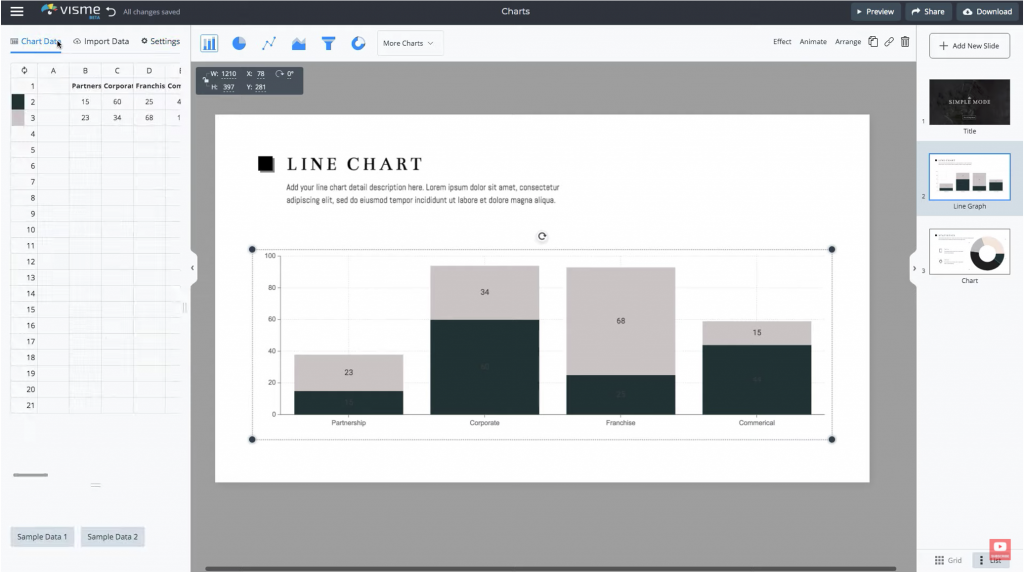
Competitive analysis study
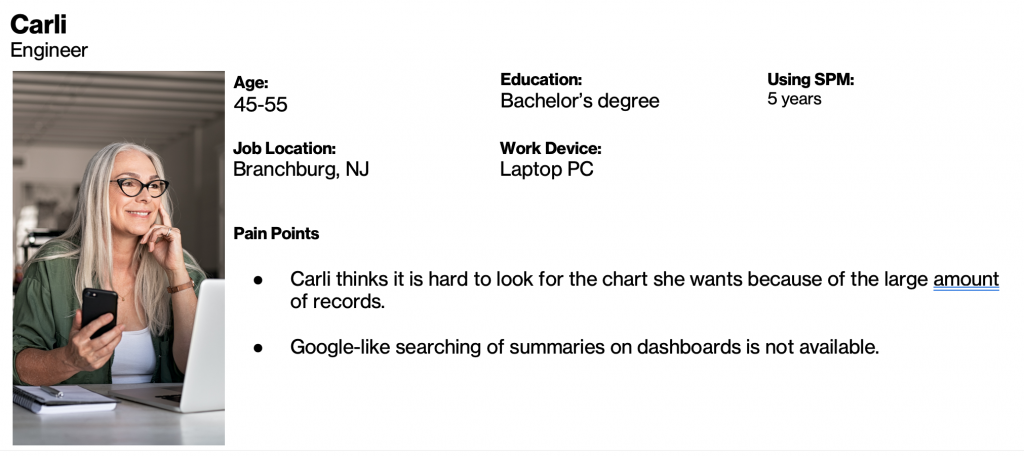
Persona
Personas are a fictional characters created after interviewing users. A lot of the research data is real and meant to help understand users needs, experiences, behaviors, and goals.
Storyboard
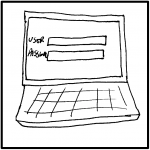
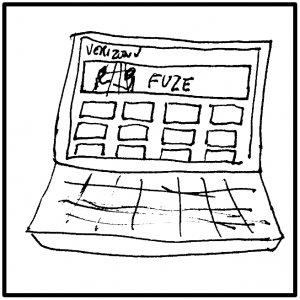
1. User logs in
2. User navigates to SPM tile
3. User opens SPM application and selects a dashboard
4. It opens to dashboard editor
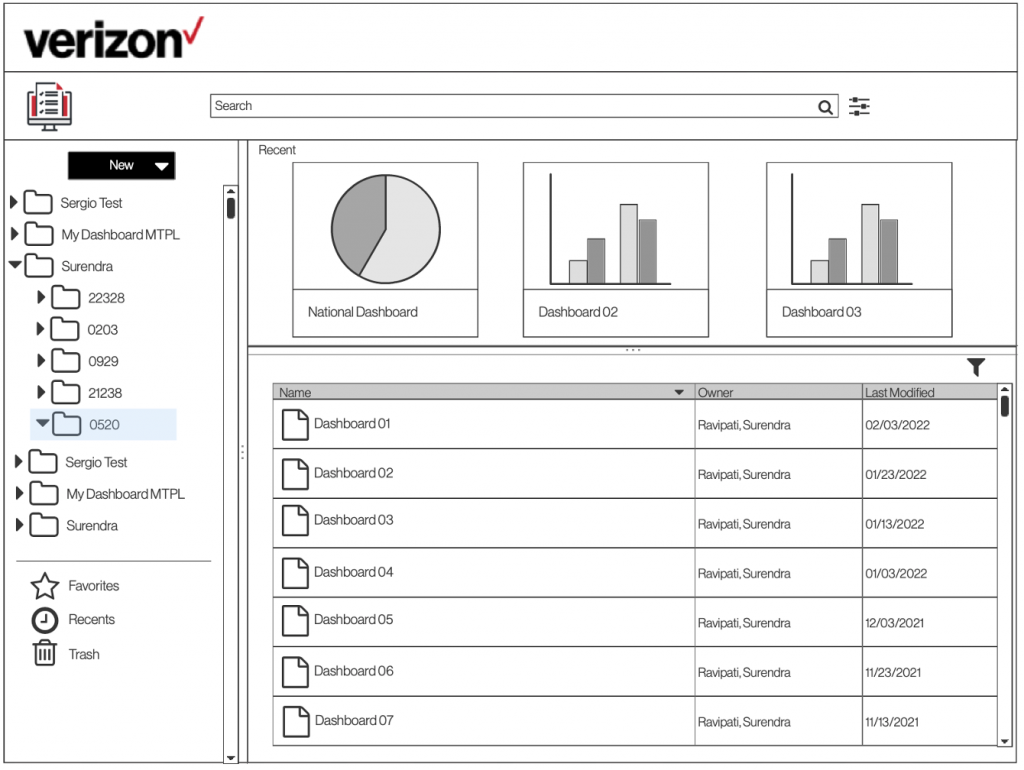
The team knew early on that we wanted to build an application that focused on improving the organization of dashboards and creating dashboards. We wanted to reduce the learning curve with having a familiar interface.
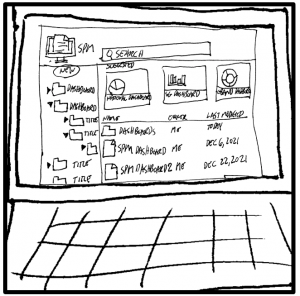
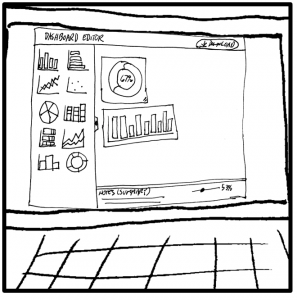
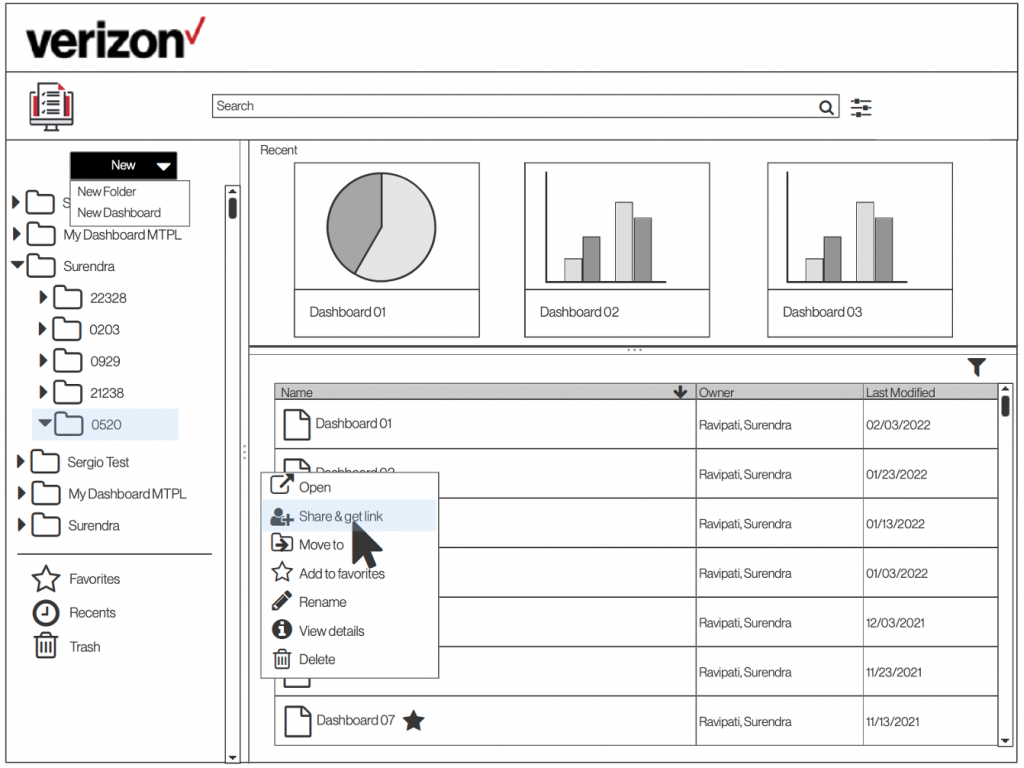
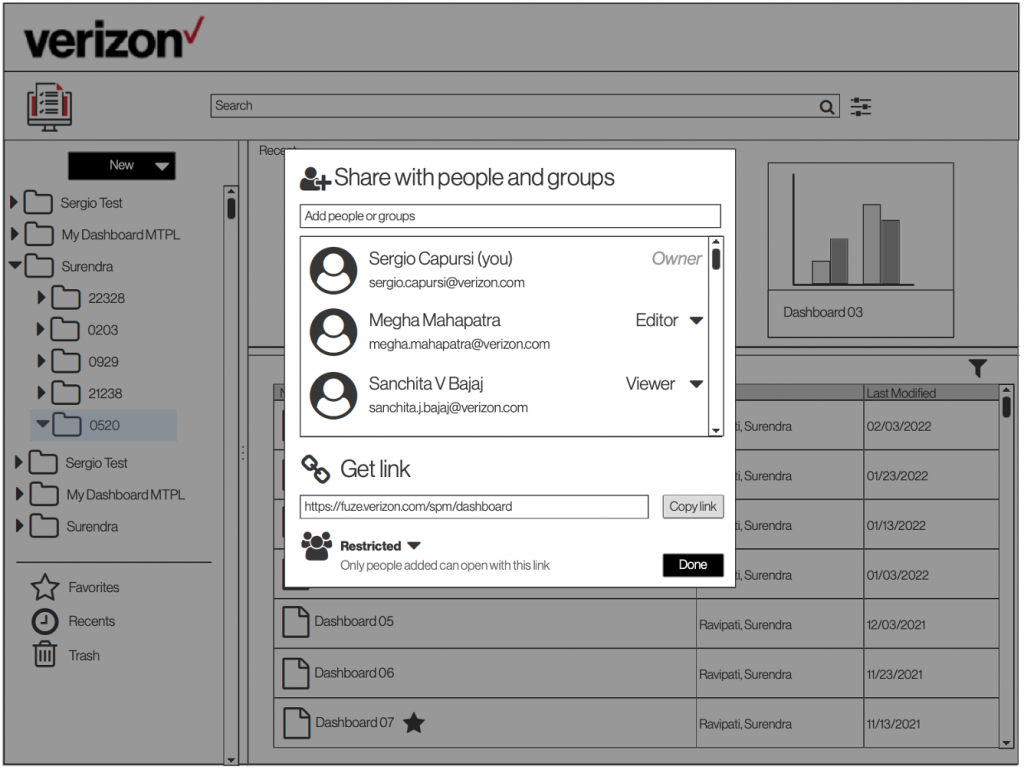
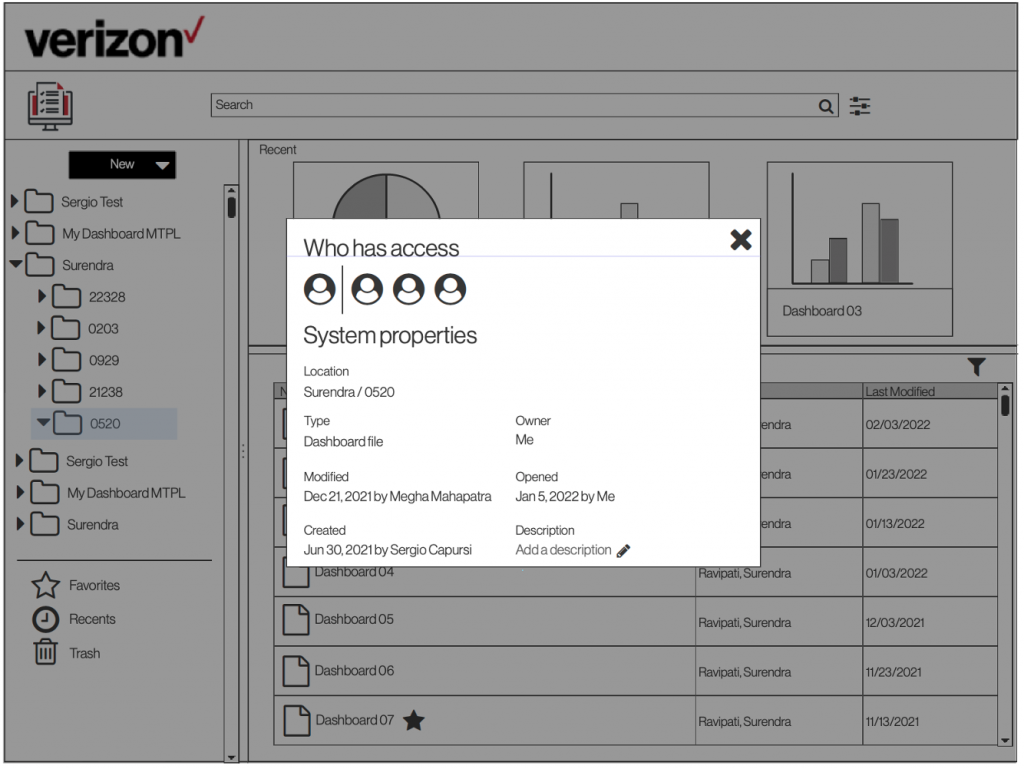
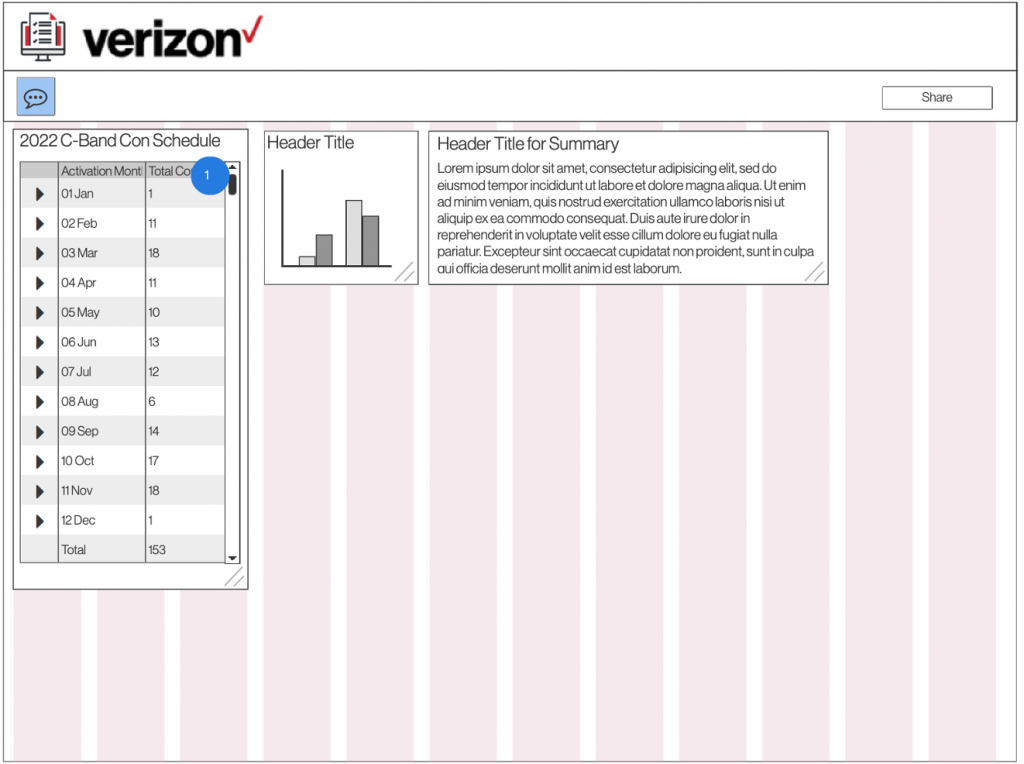
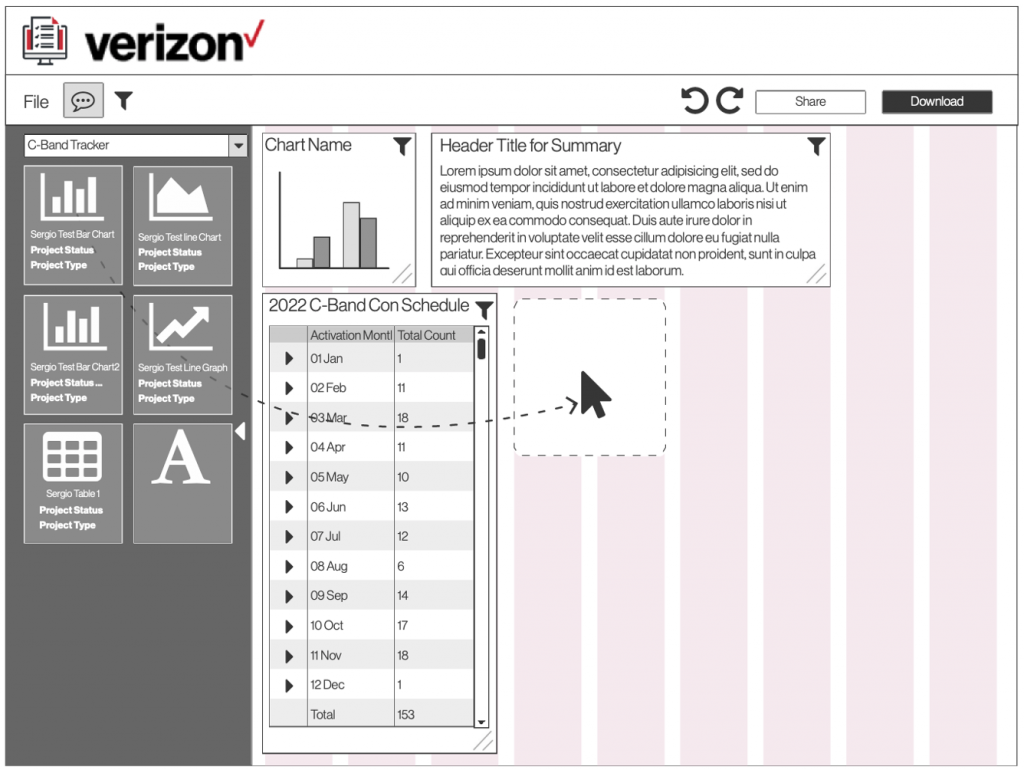
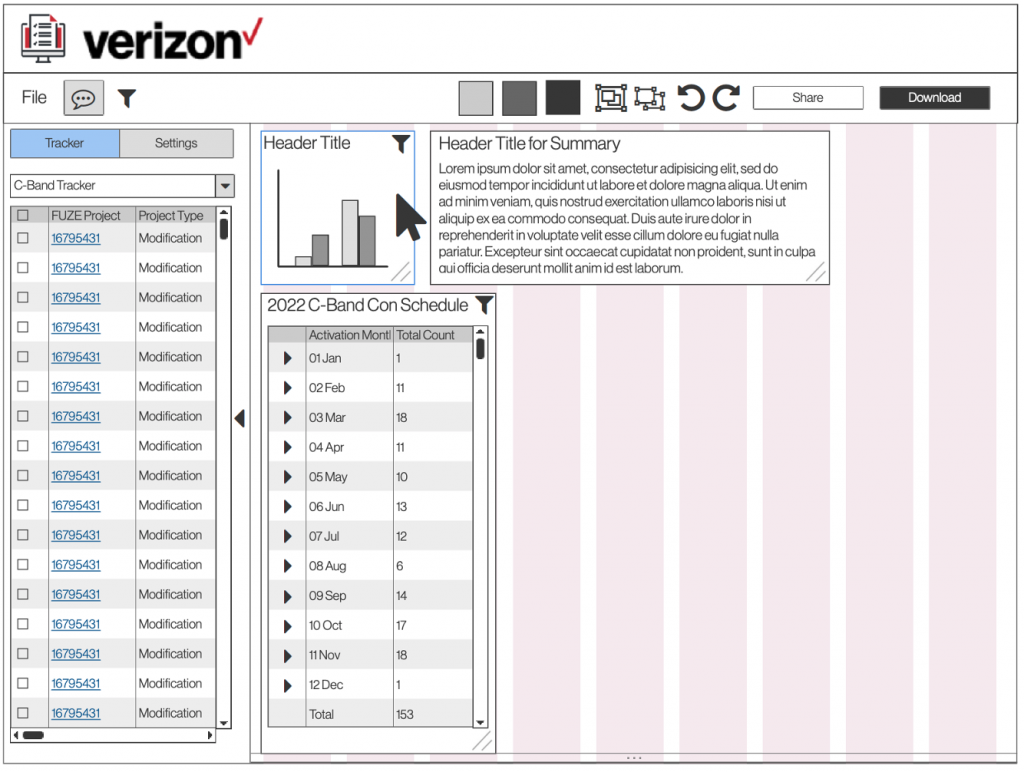
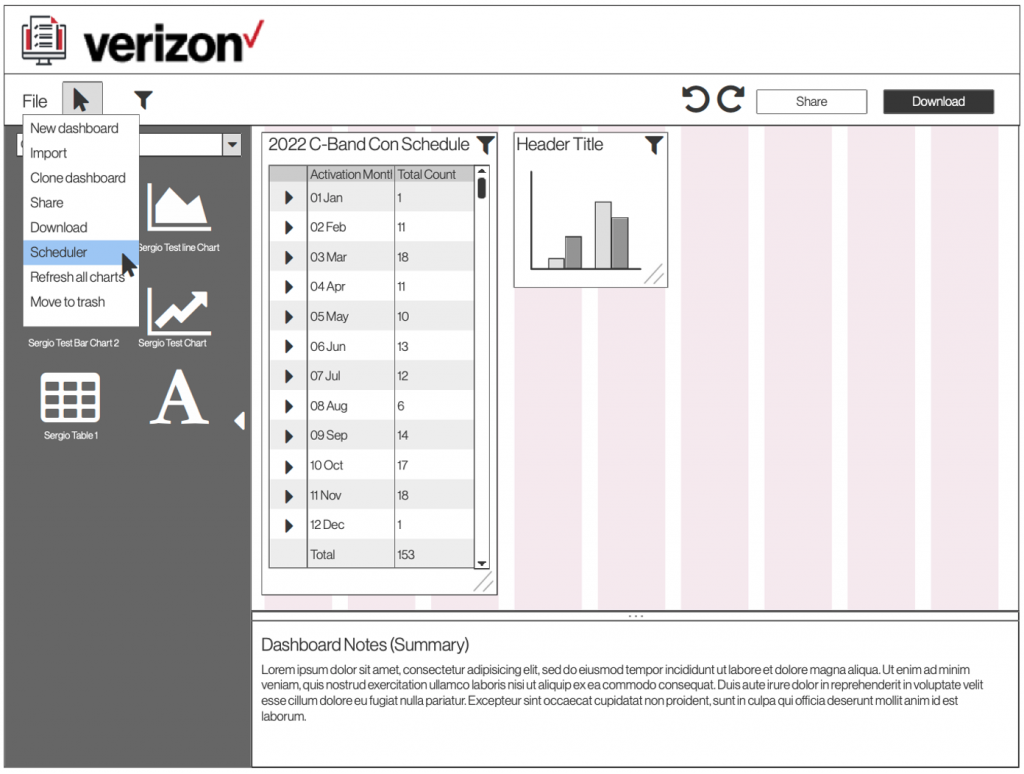
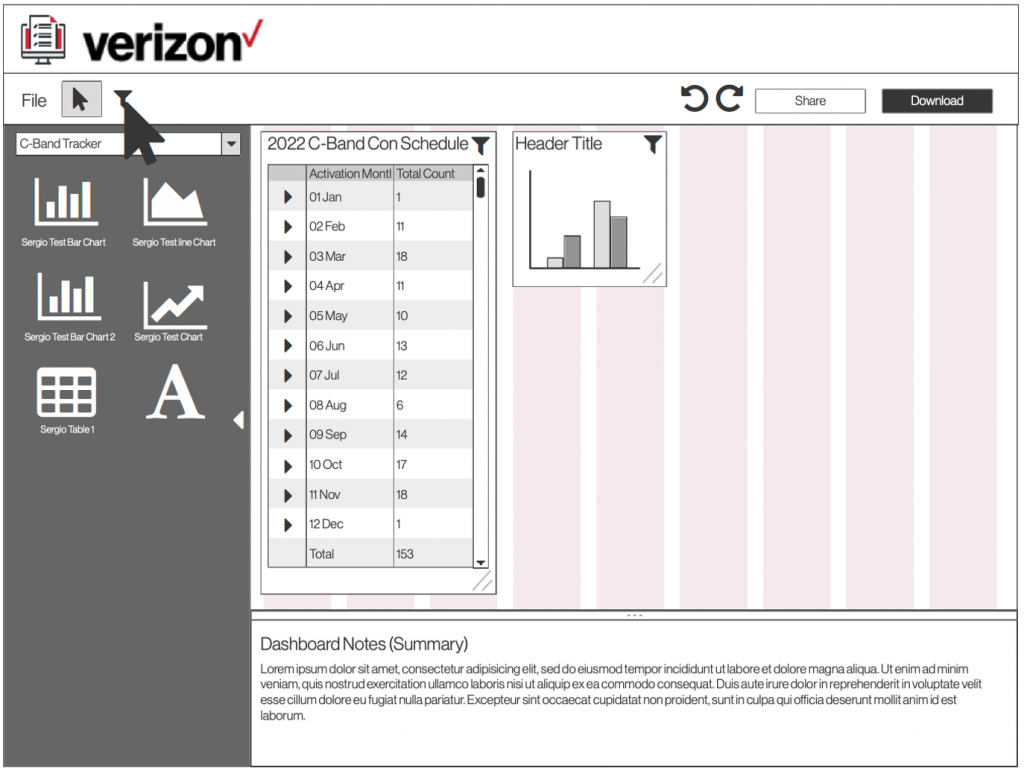
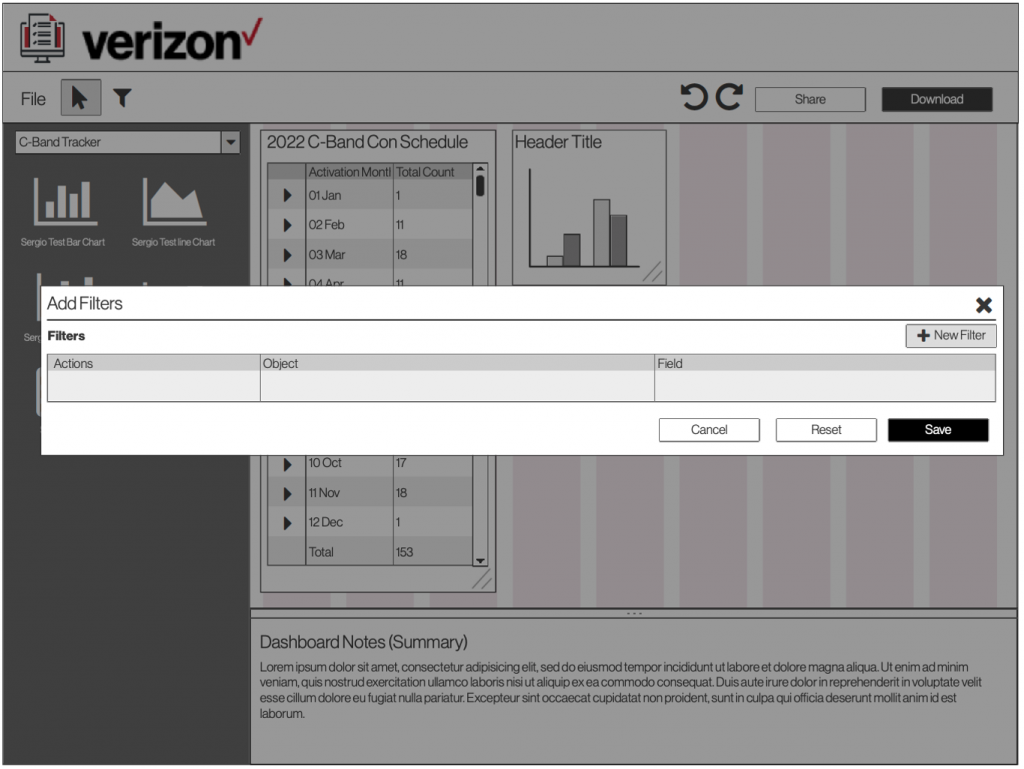
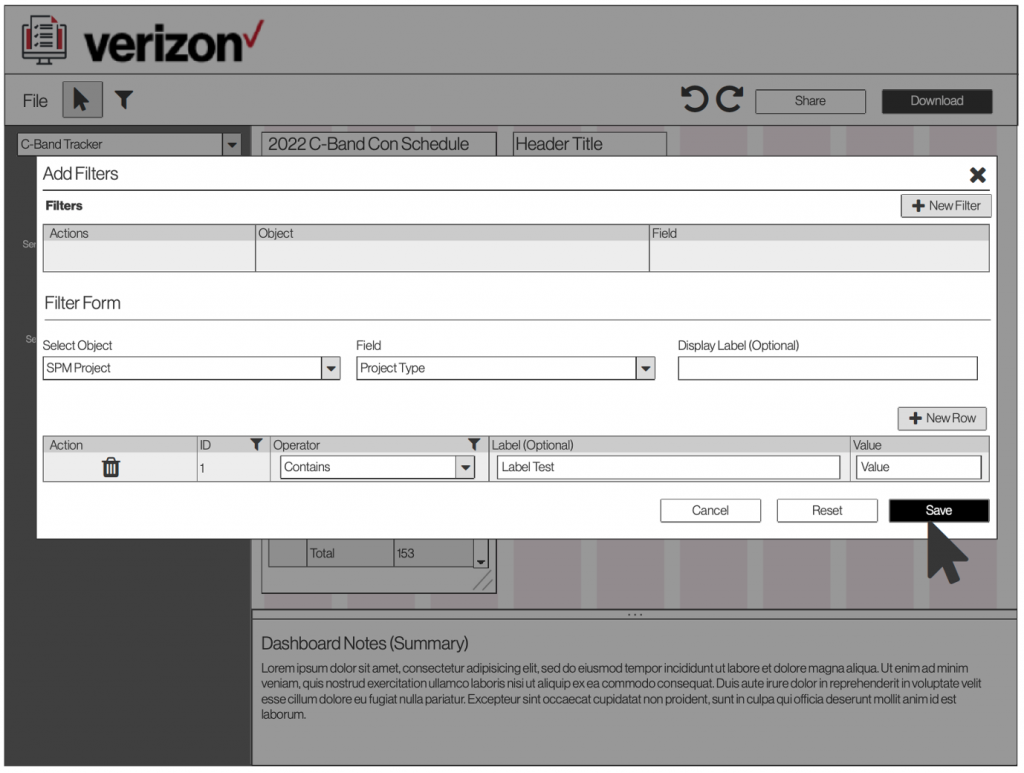
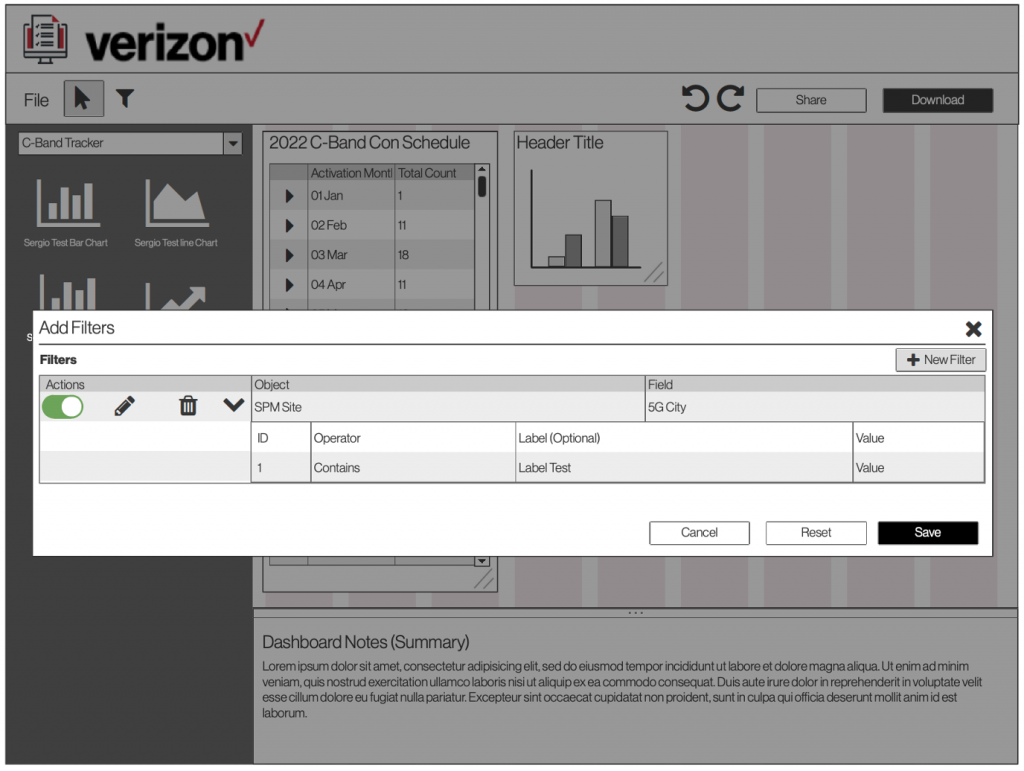
A low fidelity wireframe was produced using Balsamiq. It is a tool for quick on the fly rough wireframing.
Navigating dashboards
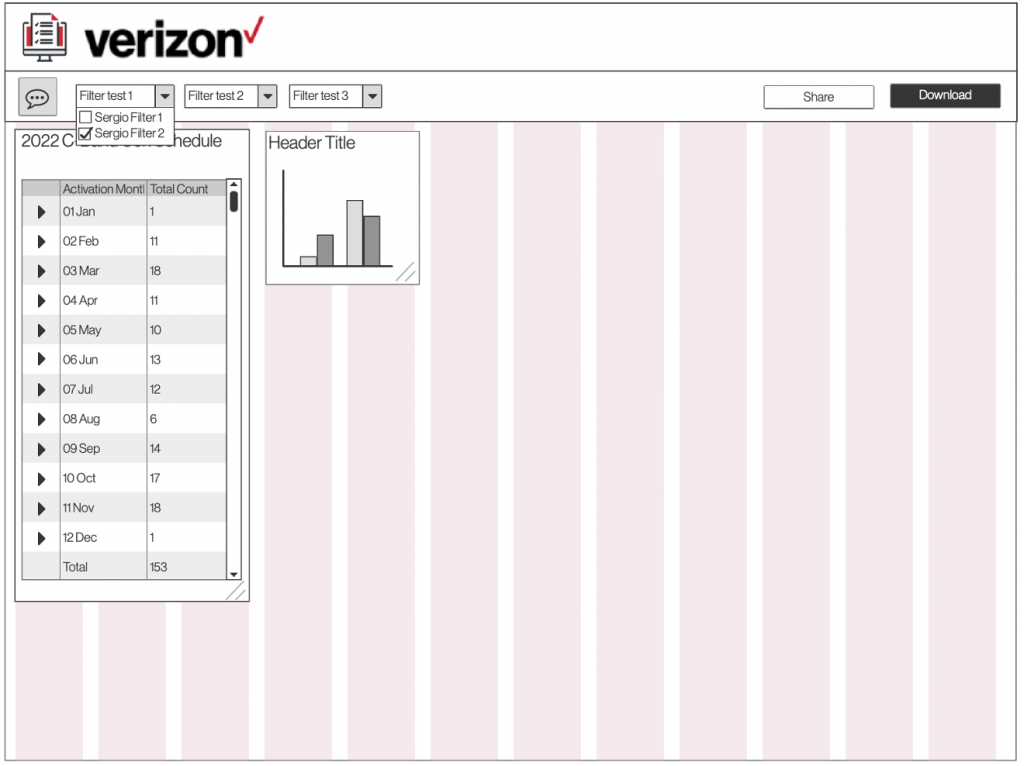
Dashboard (view only)
Dashboard (editor)
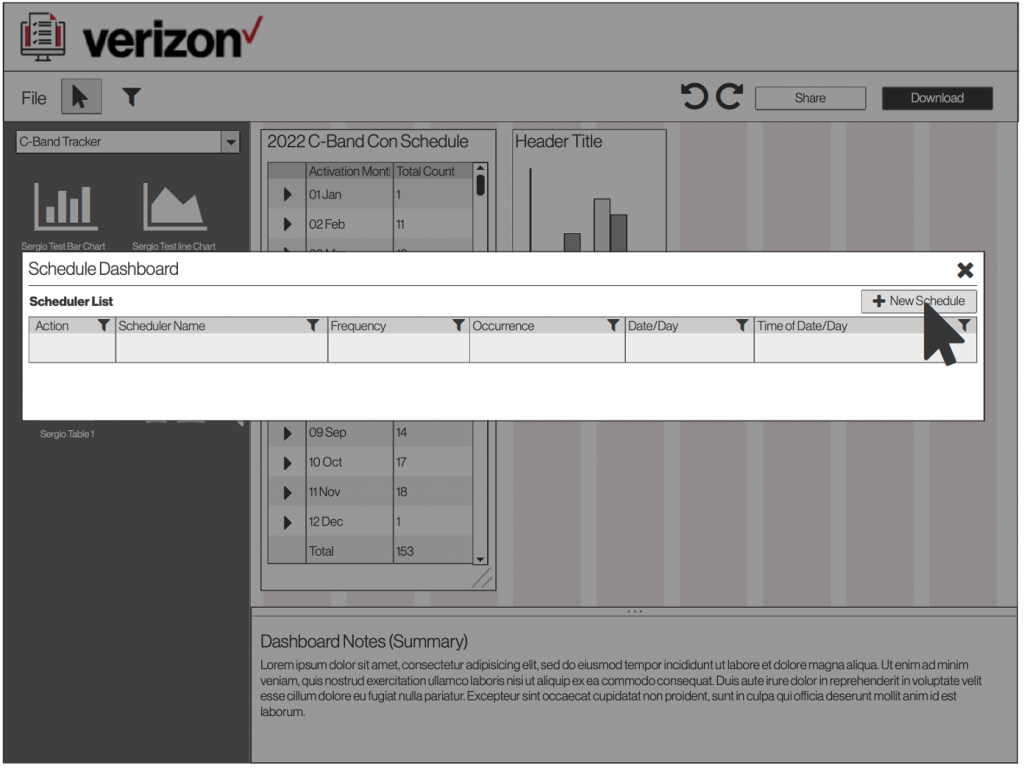
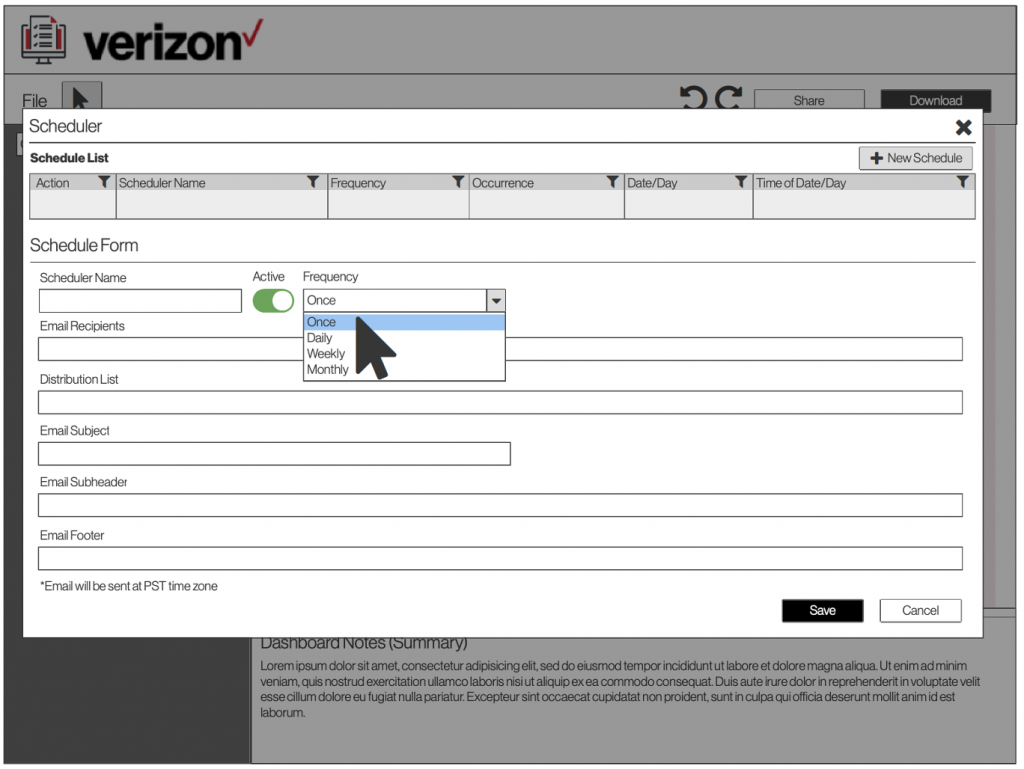
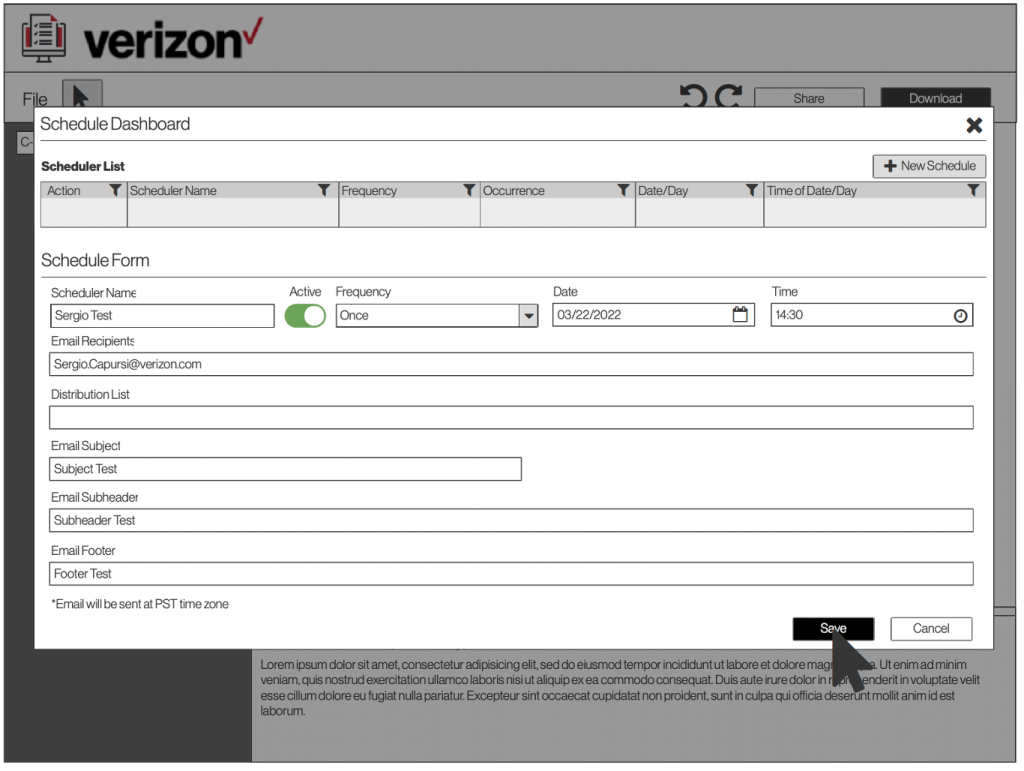
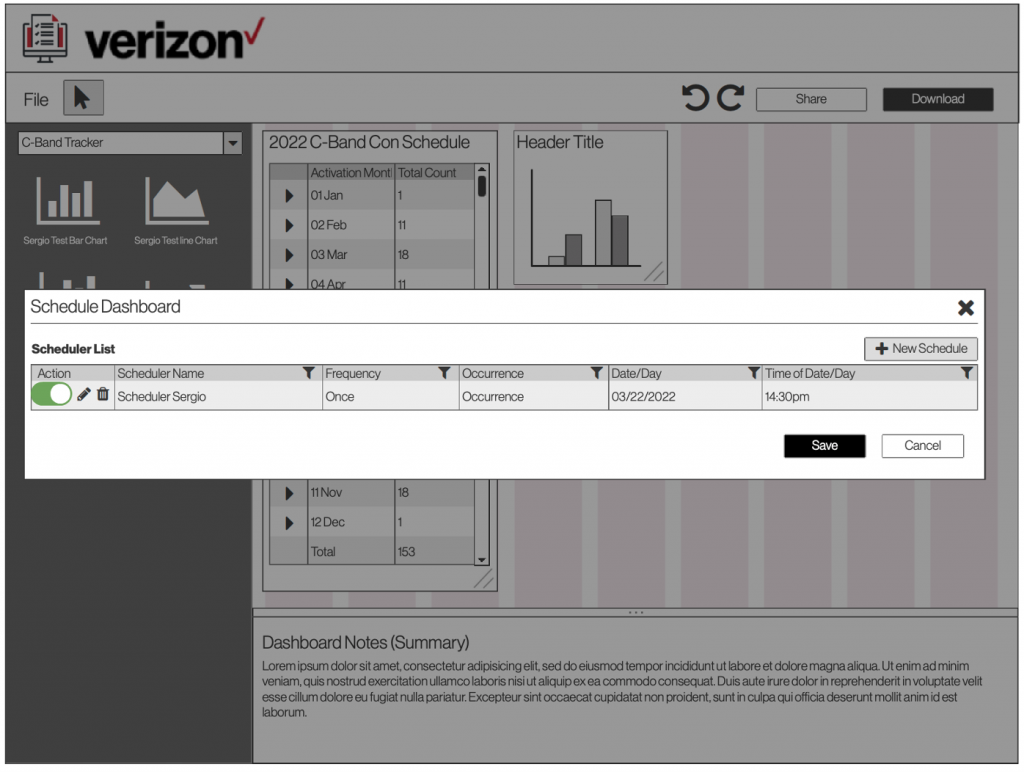
Dashboard scheduler feature
Dashboard filter feature
Prototype is when you are ready to go to high fidelity mockups using Figma. Verizon has a branding design system which was utilized and made the process easier. When creating the high fidelity mock ups the team used a UI kit from Verizon Design System (VDS).
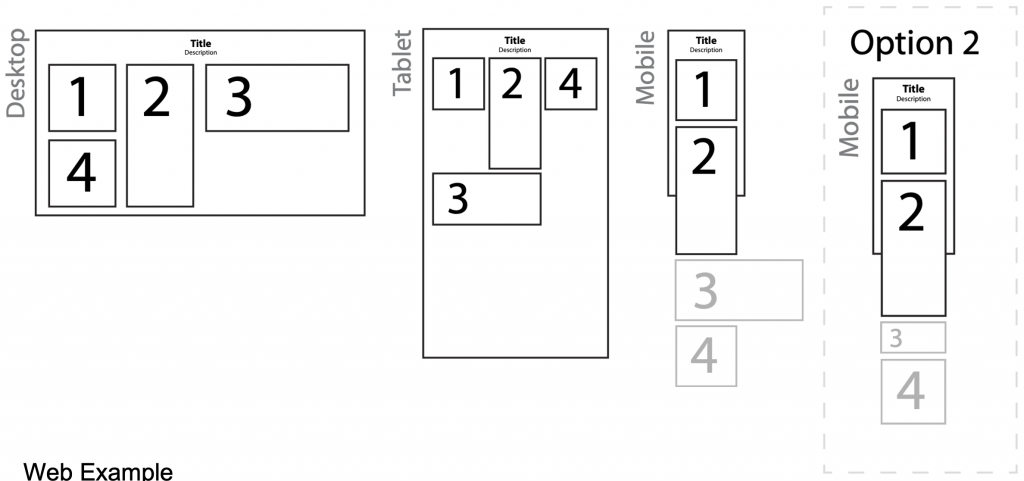
Widget grid system
To view the prototype click on the link: Prototype link
Test – is when you solicit feedback on the prototype. Another round of interviewing users asking them to sample the prototype. Testing the prototype is a way to fail cheaply and allows you to make modifications before going into development.